
Wondering if 100 likes is a strong performance? Social media benchmarks give you the industry context you need—showing what’s typical for engagement, growth, and reach. In this guide we break down the latest 2026 data across key sectors, so you can gauge where you stand and set realistic goals.
Key Takeaways
- TikTok leads with a 197% weekly follower growth rate, making it the top channel for audience expansion.
- Albums drive the best engagement on Facebook (2.9%), carousels on Instagram (4.2%), and videos on LinkedIn (3.9%).
- Quality beats quantity—often a few well‑timed posts per week generate higher engagement than daily posting.
- Benchmarks help you set achievable targets, preventing over‑ambitious or under‑ambitious goals.
- Hootsuite’s benchmarking tool lets you compare your performance against industry averages in a few clicks.
Why Benchmarks Matter
A social media benchmark is an industry standard that positions your metrics—engagement, reach, growth—next to peers. While tracking your own KPIs is valuable, benchmarks reveal whether you’re ahead, on par, or lagging behind. They also help you set realistic, SMART goals that are both ambitious and attainable.
How to Use Benchmarks
1. Gain Context for Your Numbers
Raw metrics are hard to interpret without industry context. For example, a 3% engagement rate might be stellar for healthcare but average for retail. Benchmarks clarify what “good” looks like for your sector.
2. Set Realistic, Targeted Goals
Benchmarks inform the “attainable” and “relevant” aspects of SMART objectives, ensuring you don’t aim too low or set impossible expectations.
3. Identify Industry Leaders
By spotting accounts that exceed benchmarks, you can reverse‑engineer their tactics—posting frequency, content mix, timing—and incorporate lessons into your own strategy.
4. Spot Emerging Trends Early
When growth stalls on a platform (e.g., Instagram in a given industry), benchmarks can signal a shift in focus. Use them as a launchpad for testing new approaches.
Using Hootsuite Analytics for Benchmarking
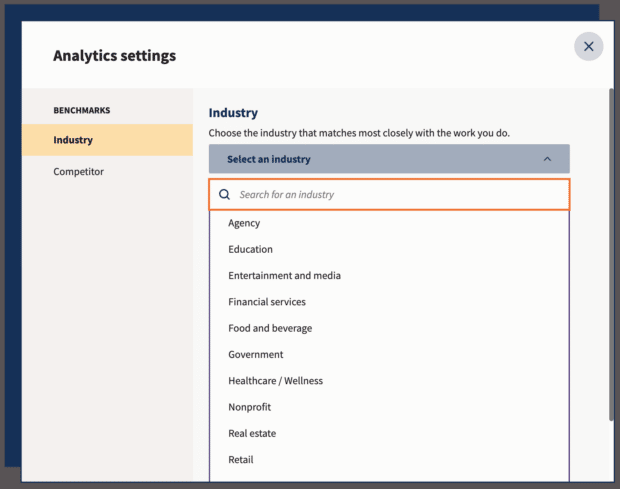
Hootsuite Analytics offers a built‑in benchmarking tool. Navigate to Analytics → Benchmarking → Industry, select your sector, and compare your performance across metrics like impressions, reach, followers, growth rate, engagement rate, video plays, posting frequency, clicks, and shares. Customize timeframes and switch between platforms (Instagram, Facebook, X, LinkedIn, TikTok). Hootsuite also provides actionable recommendations and PDF export for stakeholder reports.
#1 Social media tool Create. Schedule. Publish. Engage. Measure. Win.
Start your free trial.
2026 Benchmarks by Industry
Education
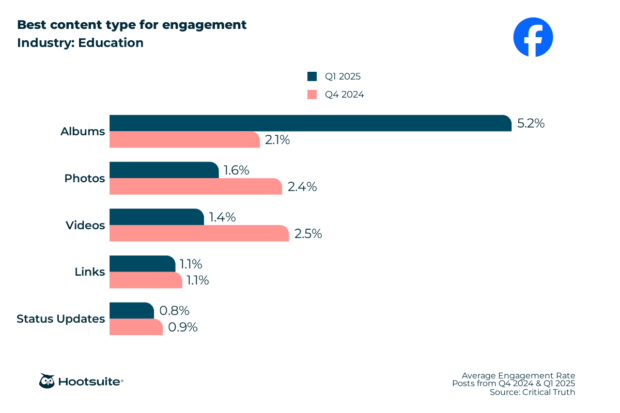
- Facebook – Best content: Albums (5.2% engagement)
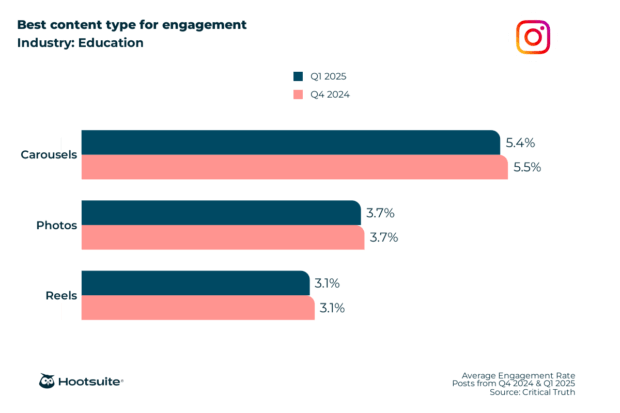
- Instagram – Best content: Carousels (5.4%)
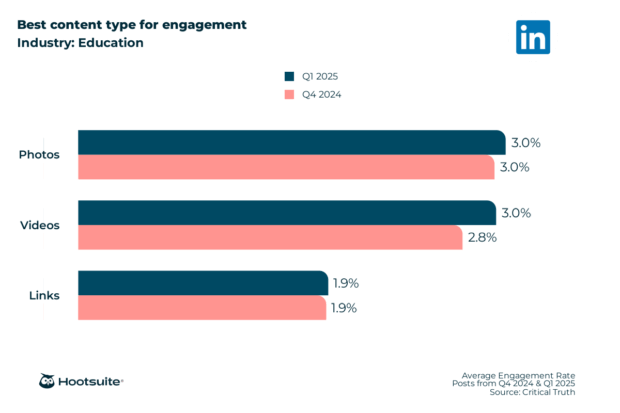
- LinkedIn – Best content: Photos & Videos (3.0%)
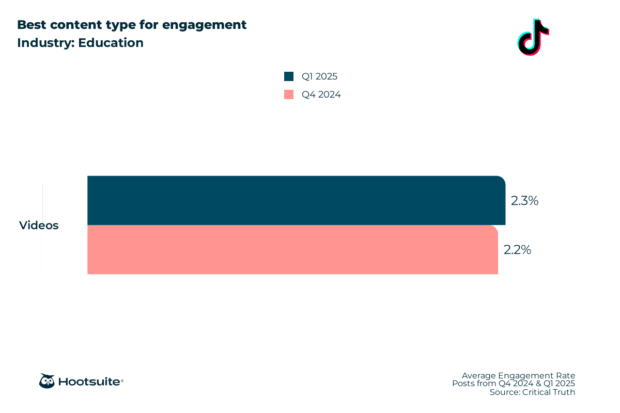
- TikTok – Best content: Videos (2.3%)
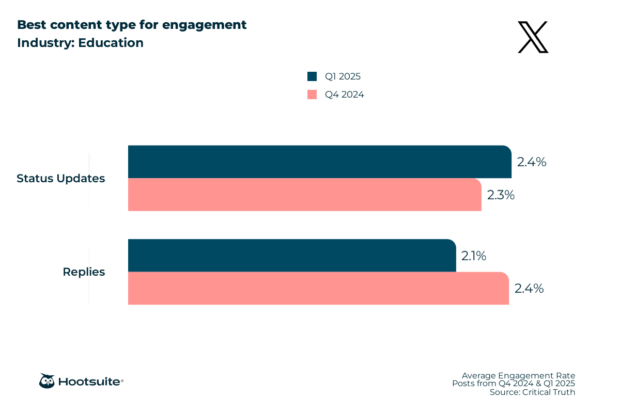
- X (Twitter) – Best content: Status Updates (2.4%)
Average follower growth: TikTok 2.28% weekly.
Optimal posting frequency: X – 10.1 posts/week; Facebook – 2 posts/week for 2.97% engagement; Instagram – 28 posts/week for 4.52% engagement; LinkedIn – 2‑3 posts/week for 2.95%; TikTok – 5 posts/week for 2.94%.
Entertainment & Media
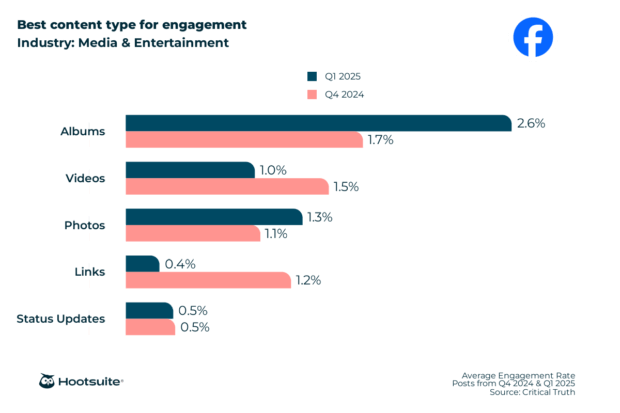
- Facebook – Albums (2.6%)
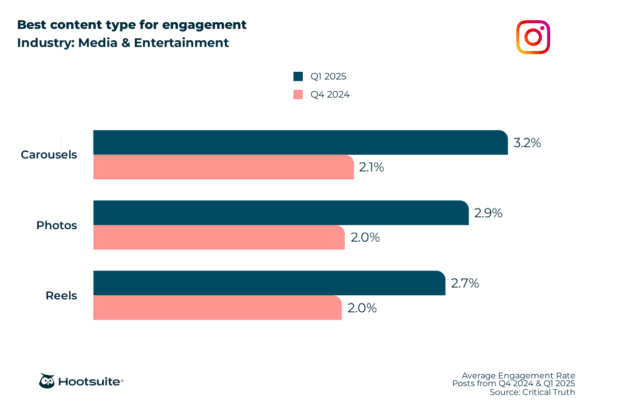
- Instagram – Carousels (3.2%) / Reels (2.7%)
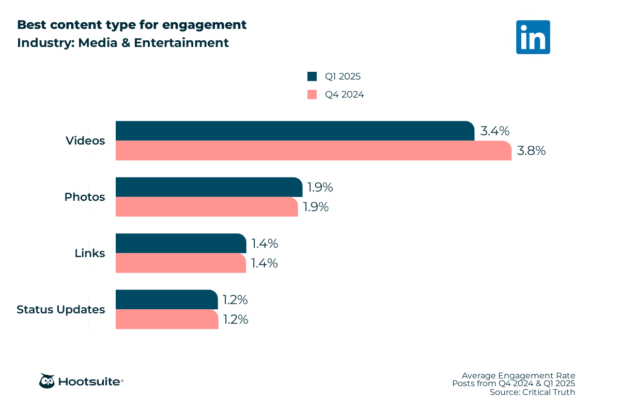
- LinkedIn – Videos (3.4%)
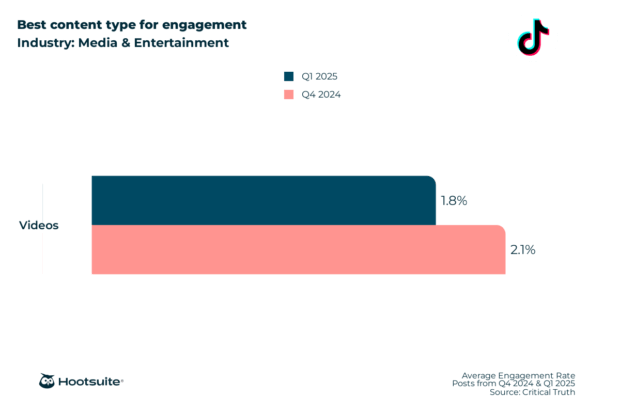
- TikTok – Videos (1.8%)
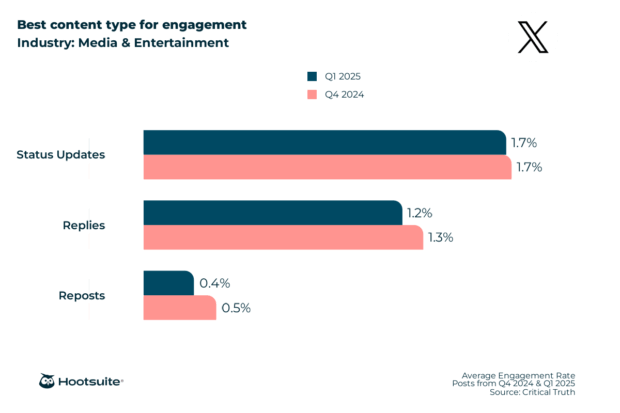
- X (Twitter) – Status Updates (1.7%)
Follower growth: TikTok 1.51%, Instagram 1.82%, LinkedIn 1.08%, X 0.15%, Facebook 0.51%.
Posting frequency & engagement: Facebook 10.8 posts/week for 1.75% engagement; Instagram 13 posts/week for 3.70%; LinkedIn 2 posts/week for 2.51%; X 24 posts/week for 2.21%; TikTok 10 posts/week for 1.81%.
Financial Services
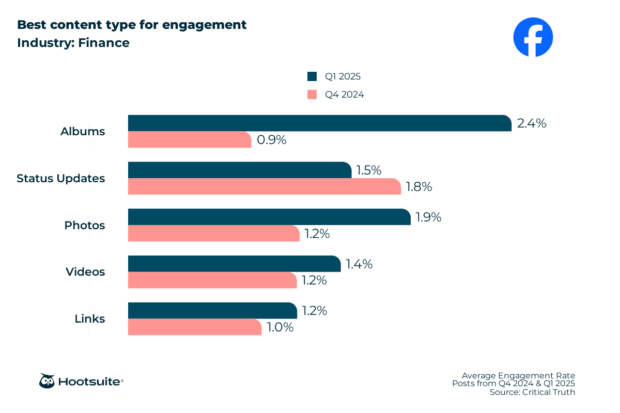
- Facebook – Albums (2.4%)
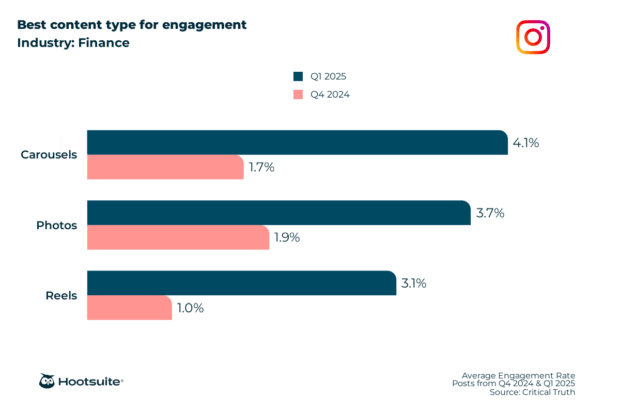
- Instagram – Carousels (4.1%)
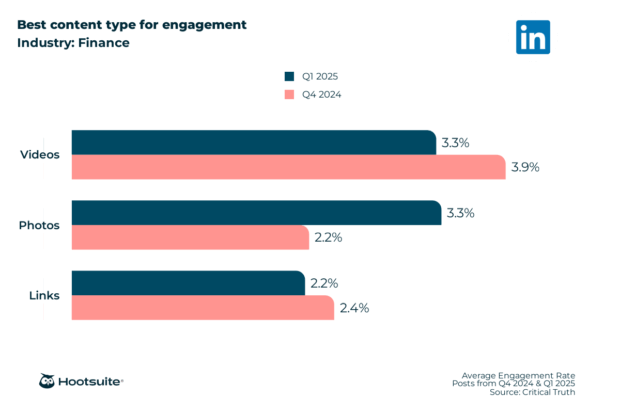
- LinkedIn – Photos & Videos (3.3%)
- TikTok – Videos (0.98%)
- X (Twitter) – Status Updates (0%)
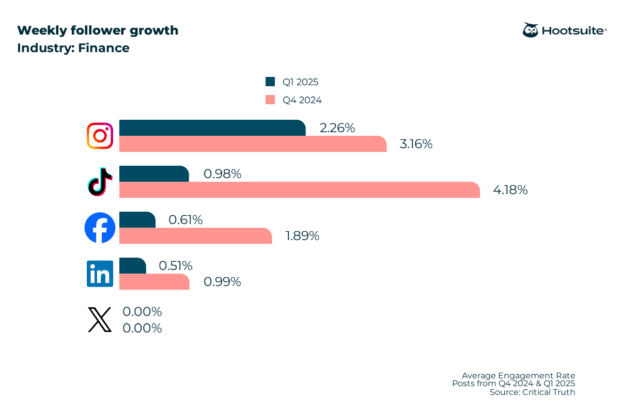
Follower growth: LinkedIn 0.51%, Instagram 2.26%, X 0%, Facebook -0.61%, TikTok 0.98%.
Posting frequency & engagement: Facebook 5.9 posts/week for 2.12% engagement; Instagram 26 posts/week for 4.64%; LinkedIn 2 posts/week for 3.44%; X 2 posts/week for 2.06%; TikTok 4 posts/week for 1.58%.
Dining, Hospitality & Tourism
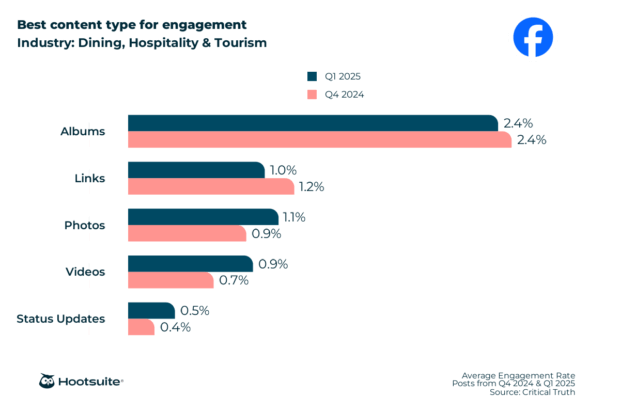
- Facebook – Albums (2.4%)
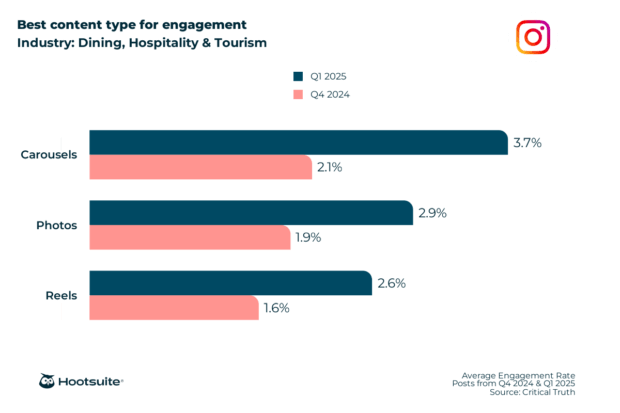
- Instagram – Carousels (3.7%)
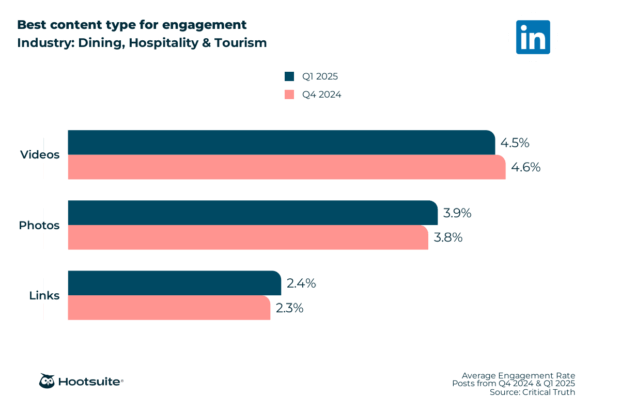
- LinkedIn – Videos (4.5%)
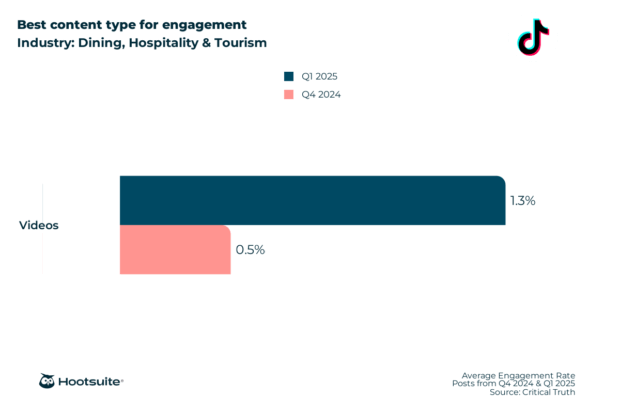
- TikTok – Videos (1.3%)
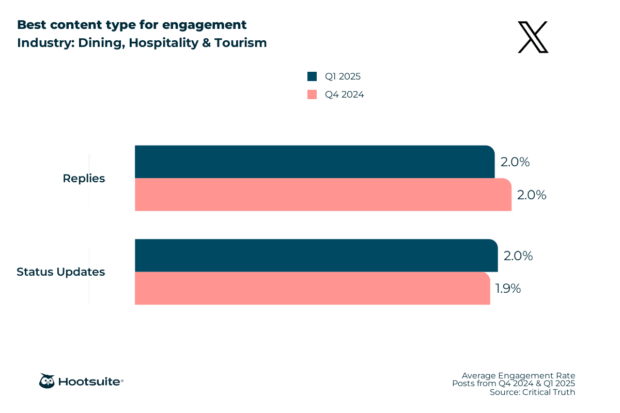
- X (Twitter) – Replies & Status Updates (2.0%)
Follower growth: TikTok 18.75%, Instagram 1.10%, Facebook 9.11%, LinkedIn 0.45%, X 0%.
Posting frequency & engagement: Facebook 9.9 posts/week for 1.58% engagement; Instagram 11.9 posts/week for 3.52%; LinkedIn 2 posts/week for 3.52%; X 8‑10 posts/week for 2.14%; TikTok 2 posts/week for 1.36%.
Government‑Related Services
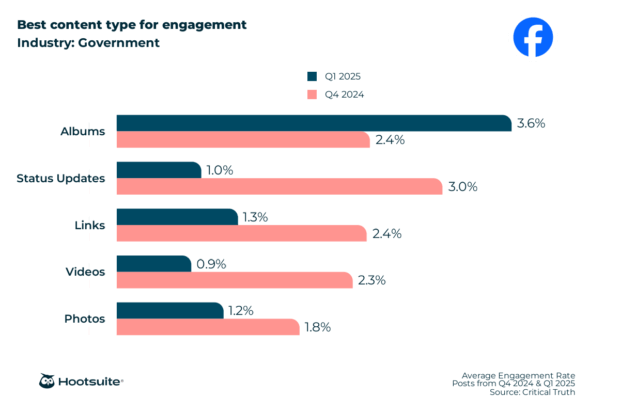
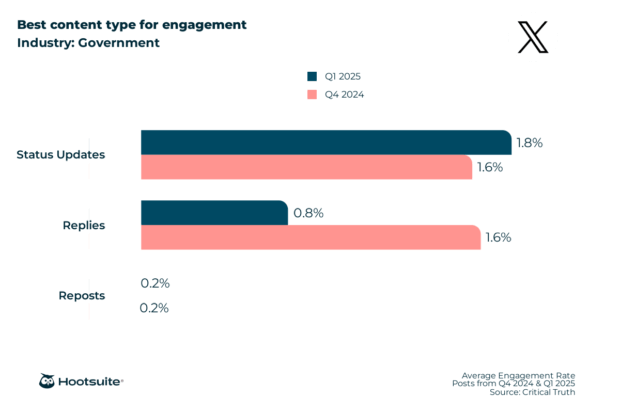
- Facebook – Albums (3.6%)
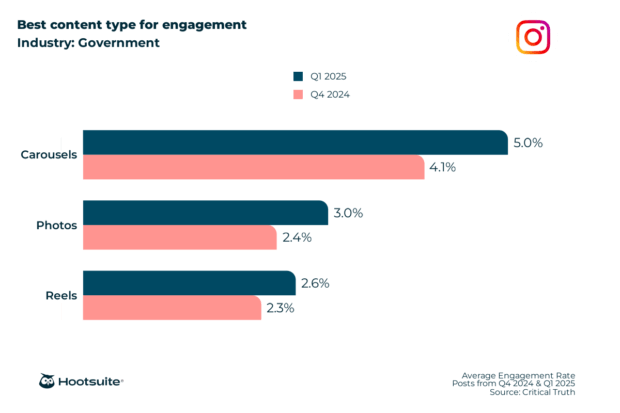
- Instagram – Carousels (5.0%)
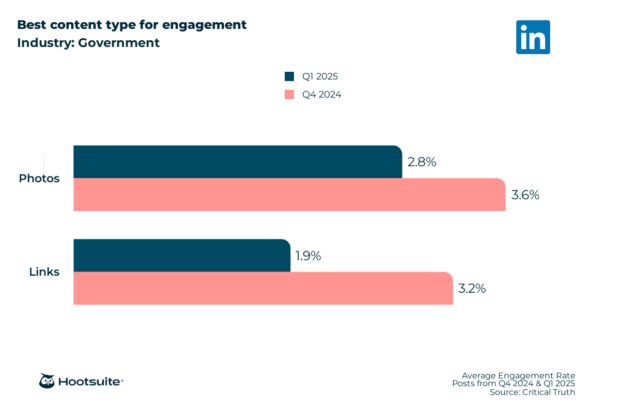
- LinkedIn – Photos (2.8%)
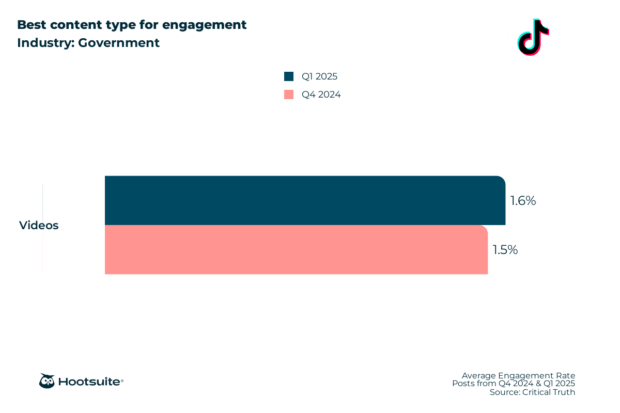
- TikTok – Videos (1.6%)
- X (Twitter) – Status Updates (1.8%)
Follower growth: Instagram 2.17%, Facebook 1.38%, LinkedIn 0.39%, TikTok 0.70%, X 0%.
Posting frequency & engagement: Facebook 16.1 posts/week for 2.32% engagement; LinkedIn 3 posts/week for 2.80%; X 2 posts/week for 2.03%; TikTok 5 posts/week for 0.85%.
Healthcare
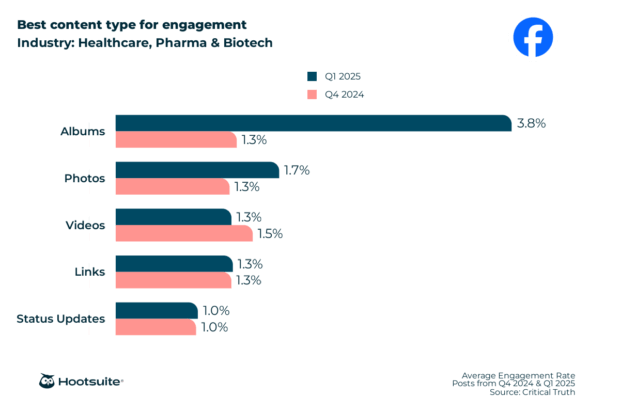
- Facebook – Albums (3.8%)
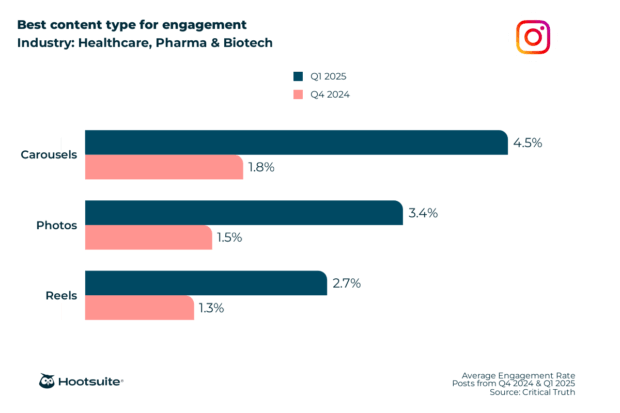
- Instagram – Carousels (4.5%)
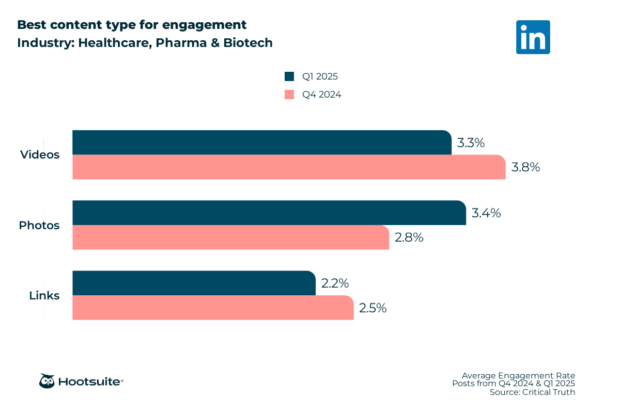
- LinkedIn – Photos (3.4%)
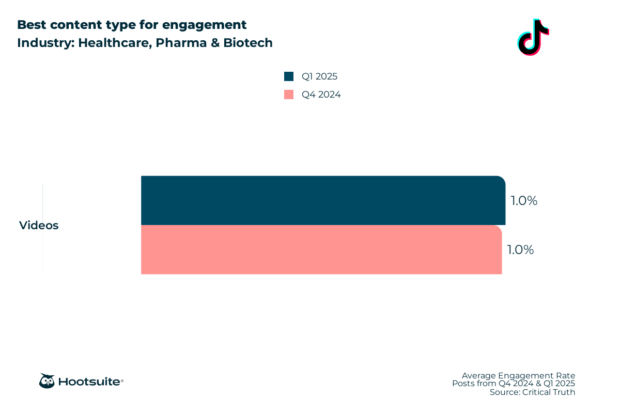
- TikTok – Videos (1.0%)
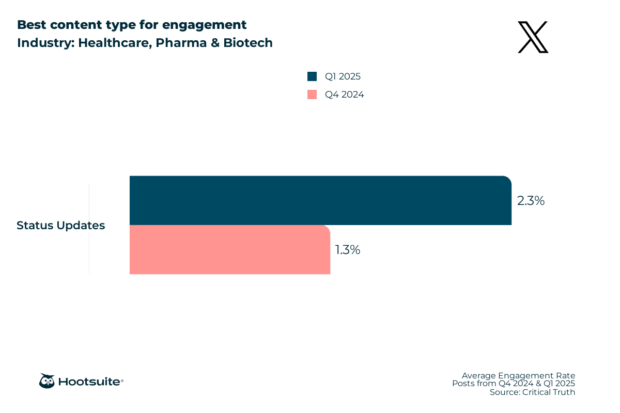
- X (Twitter) – Status Updates (2.3%)
Follower growth: Facebook 10.11%, TikTok 1.82%, Instagram 1.10%, LinkedIn 0.94%, X 0%.
Posting frequency & engagement: Facebook 11.4 posts/week for 2.22% engagement; Instagram 2 posts/week for 3.89%; LinkedIn 20 posts/week for 3.61%; X 28 posts/week for 2.65%; TikTok 7 posts/week for 1.03%.
Real Estate, Legal & Other Professionals
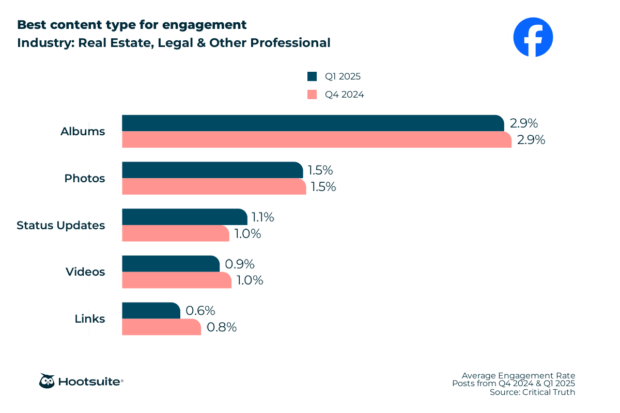
- Facebook – Albums (2.9%)
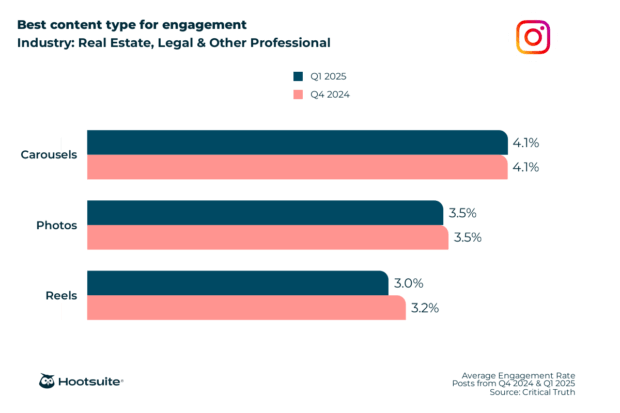
- Instagram – Carousels (4.1%)
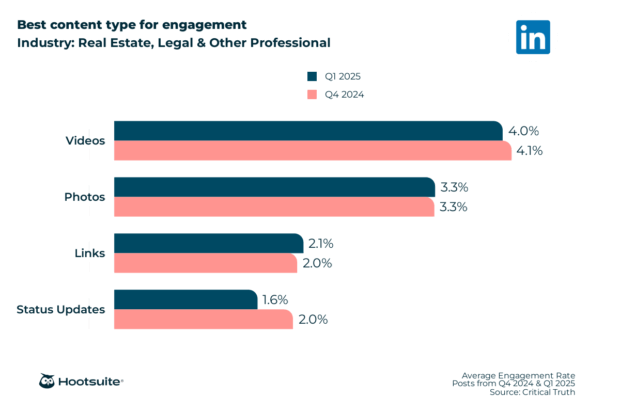
- LinkedIn – Videos (4.0%)
Follower growth: TikTok 1.62%, LinkedIn 0.90%, Instagram 0.97%, Facebook 1.60%, X 0%.
Posting frequency & engagement: Facebook 11.6 posts/week for 2.09% engagement; Instagram 2 posts/week for 4.23%; LinkedIn 19 posts/week for 3.36%; X 10 posts/week for 2.21%; TikTok 3 posts/week for 0.95%.
Retail
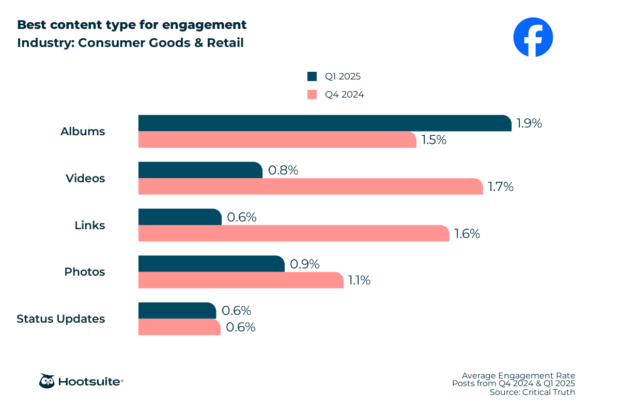
- Facebook – Albums (1.9%)
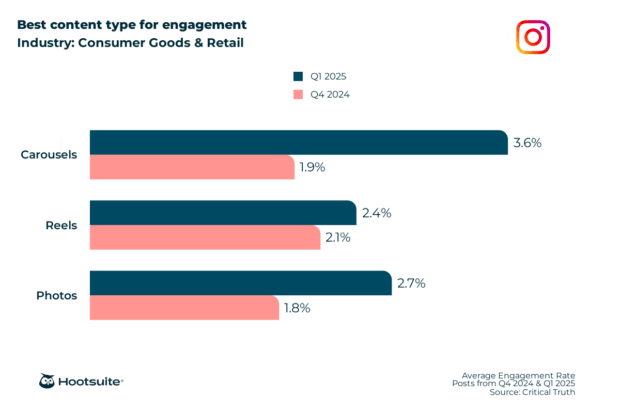
- Instagram – Carousels (3.6%)
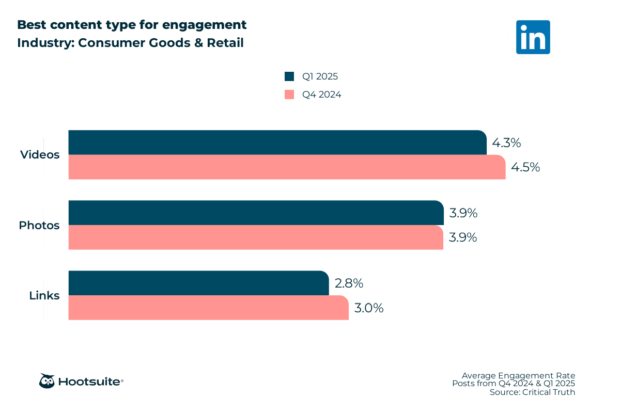
- LinkedIn – Videos (4.3%)
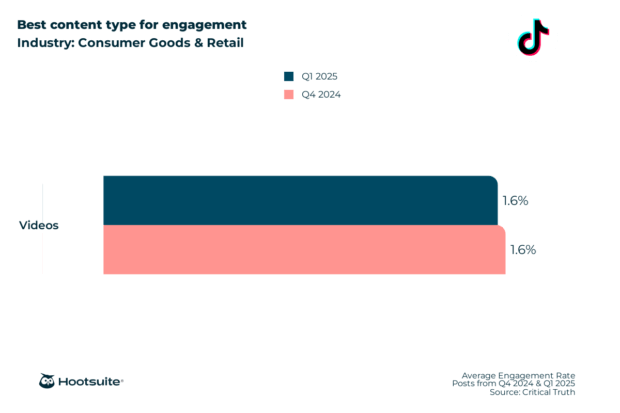
- TikTok – Videos (1.6%)
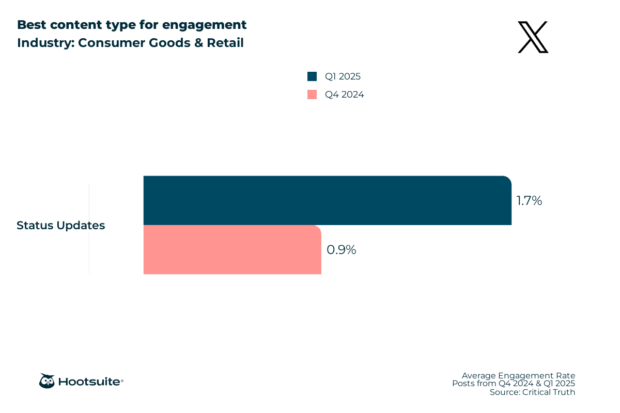
- X (Twitter) – Status Updates (1.7%)
Follower growth: Facebook 2.43%, Instagram 1.02%, LinkedIn 0.57%, TikTok 0.91%, X 0.03%.
Posting frequency & engagement: Facebook 9.0 posts/week for 1.54% engagement; Instagram 25 posts/week for 3.66%; LinkedIn 15 posts/week for 4.15%; X 8 posts/week for 1.88%; TikTok 4‑5 posts/week for 1.74%.
Construction, Mining & Manufacturing
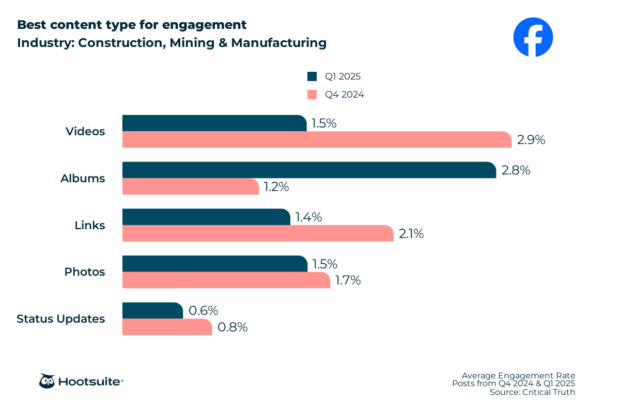
- Facebook – Albums (2.8%)
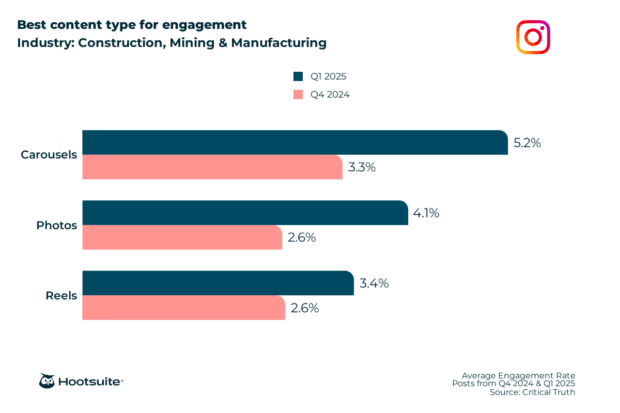
- Instagram – Carousels (5.2%)
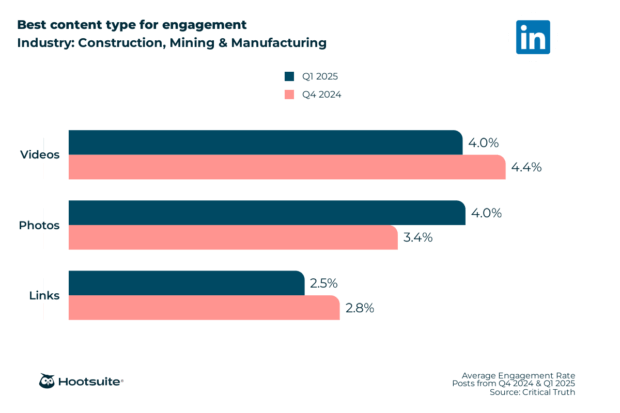
- LinkedIn – Videos & Photos (4.0%)
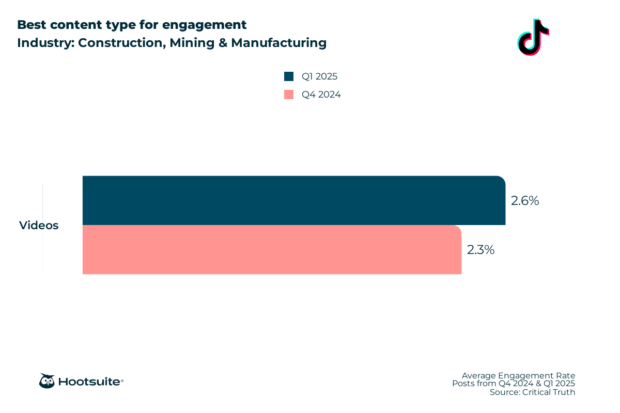
- TikTok – Videos (2.6%)
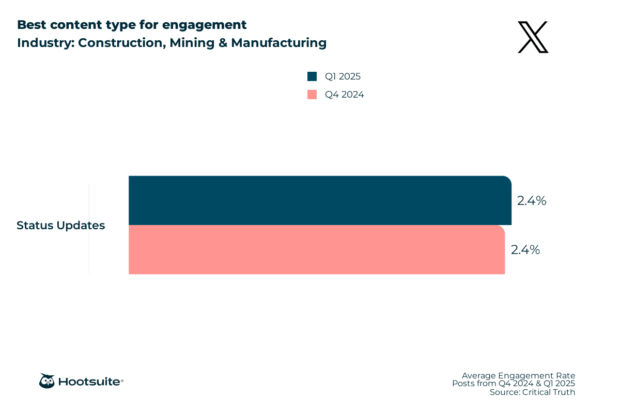
- X (Twitter) – Status Updates (2.4%)
Follower growth: TikTok & Instagram 1.71%, LinkedIn 0.87%, Facebook 0.37%, X 0%.
Posting frequency & engagement: Facebook 7.9 posts/week for 2.31% engagement; Instagram 28 posts/week for 5.02%; LinkedIn 2 or 20 posts/week for 4.13%; X 2 posts/week for 2.58%; TikTok 3 posts/week for 2.60%.
Marketing Agencies
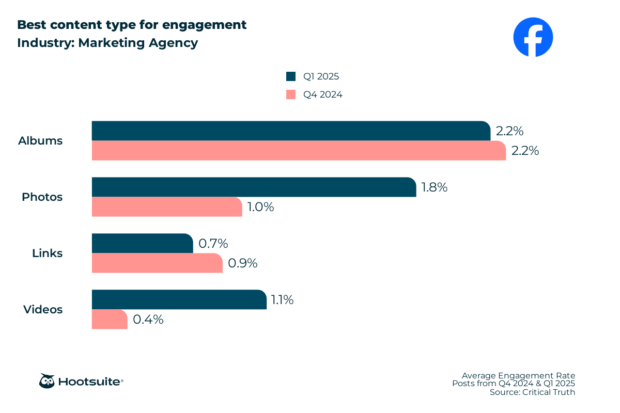
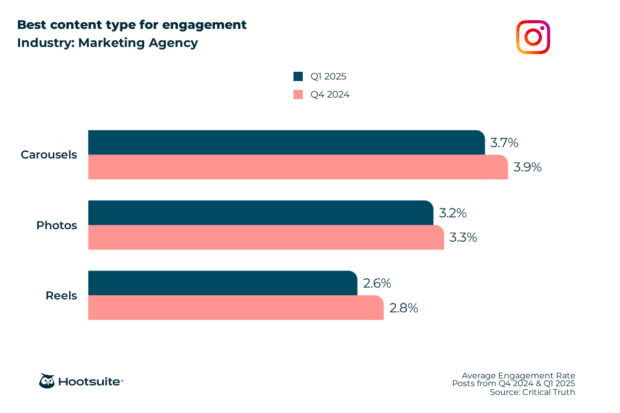
- Facebook – Albums (2.2%)
- Instagram – Carousels (3.7%)
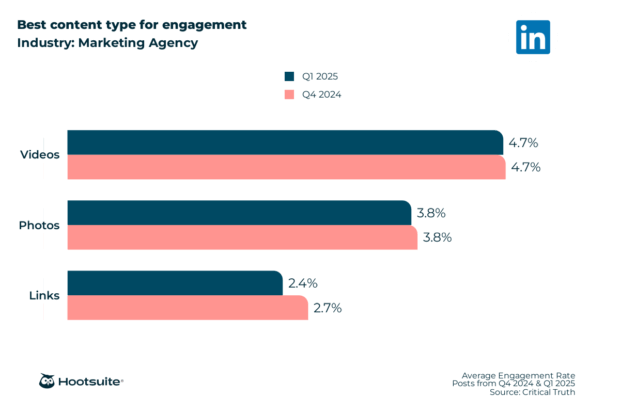
- LinkedIn – Videos (4.7%)
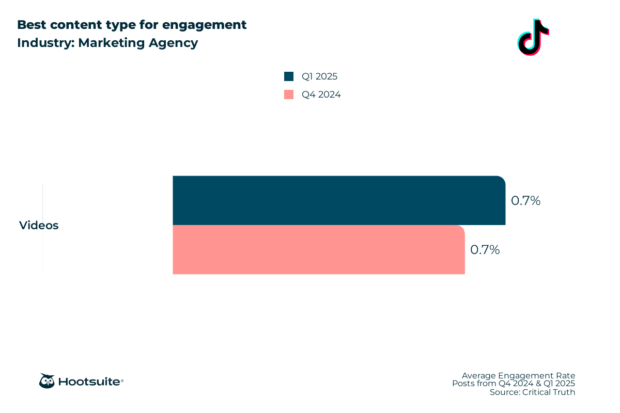
- TikTok – Videos (0.7%)
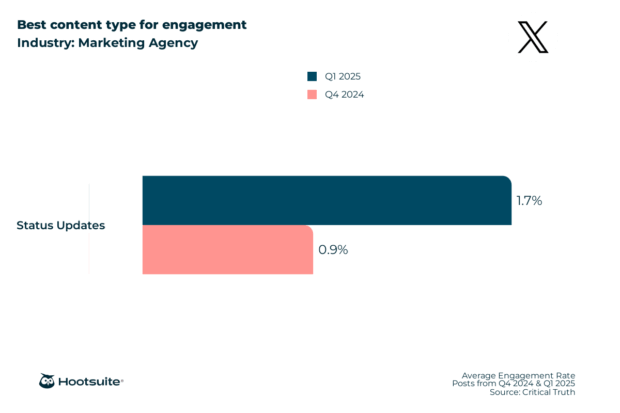
- X (Twitter) – Status Updates (1.7%)
Follower growth: TikTok 6.08%, LinkedIn 1.38%, Instagram 1.36%, Facebook 1.62%, X 0%.
Posting frequency & engagement: Facebook 10.8 posts/week for 2.08% engagement; Instagram 10.3 posts/week for 4.00%; LinkedIn 19 posts/week for 4.02%; X 9 posts/week for 2.09%; TikTok 6 posts/week for 0.88%.
Nonprofits
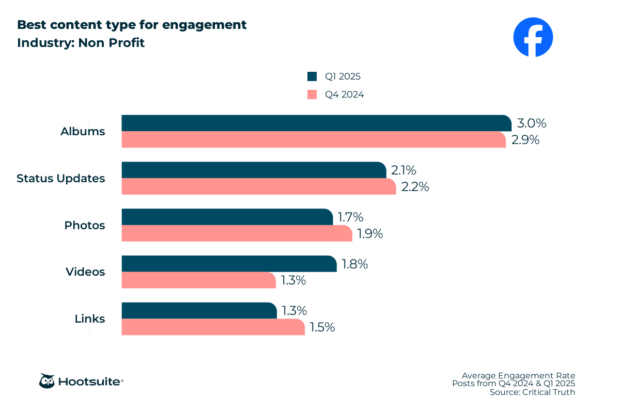
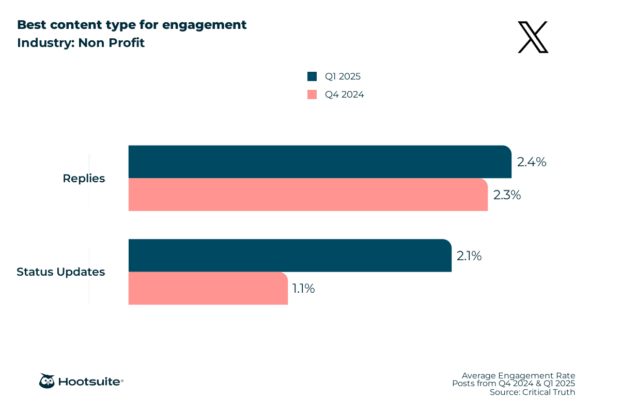
- Facebook – Albums (3.0%)
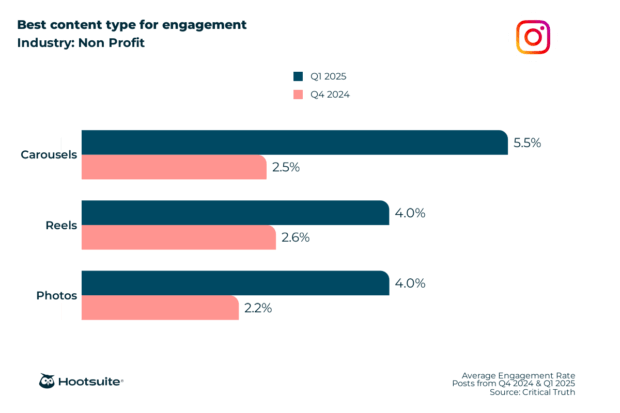
- Instagram – Carousels (5.5%)
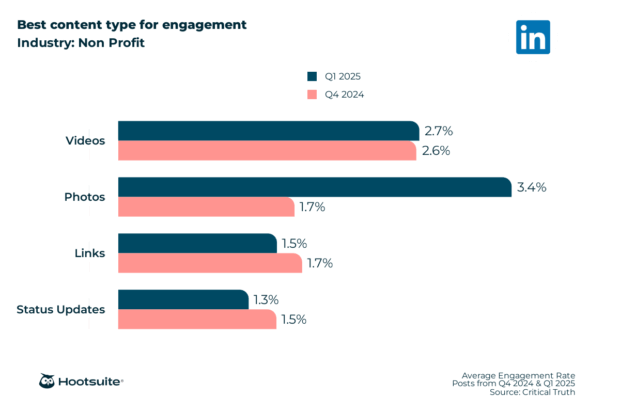
- LinkedIn – Photos (3.4%)
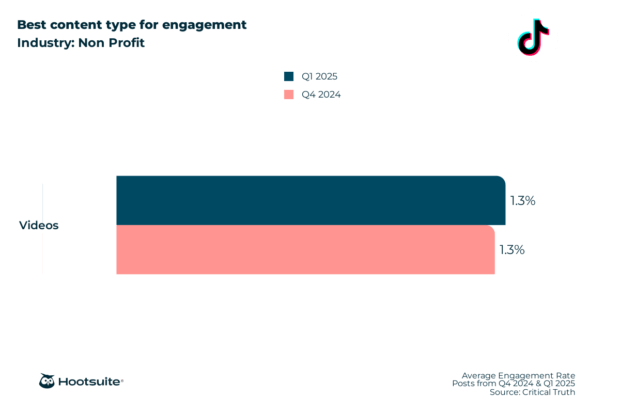
- TikTok – Videos (1.3%)
- X (Twitter) – Replies (2.4%)
Follower growth: TikTok 2.15%, Instagram 0.62%, Facebook 0.57%, LinkedIn 0.48%, X 0%.
Posting frequency & engagement: Facebook 9.5 posts/week for 2.36% engagement; Instagram 25 posts/week for 4.95%; LinkedIn 2 posts/week for 3.58%; X 2 or 24 posts/week for 2.44%; TikTok 3 posts/week for 1.67%.
Technology
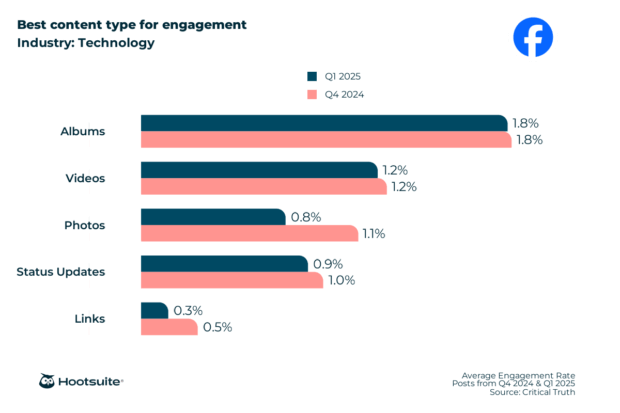
- Facebook – Albums (1.8%)
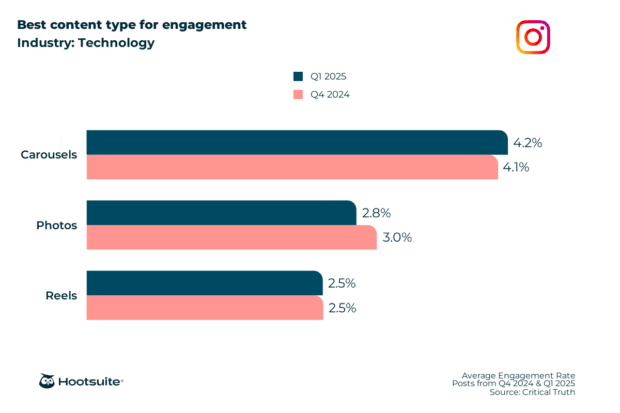
- Instagram – Carousels (4.2%)
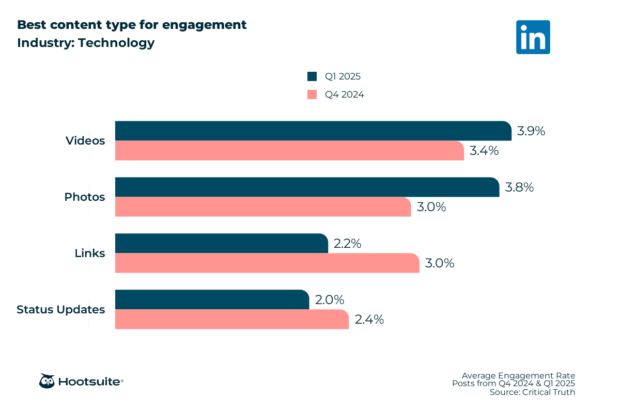
- LinkedIn – Videos (3.9%)
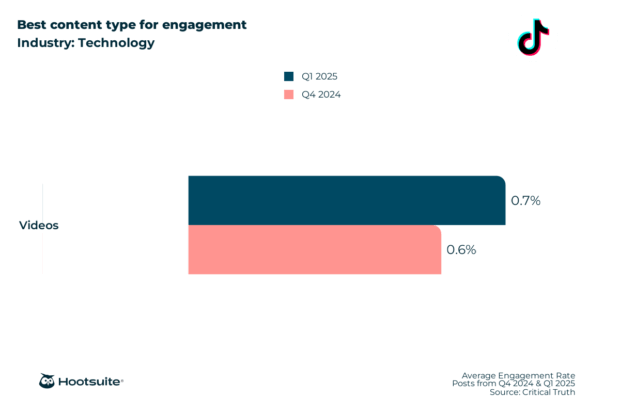
- TikTok – Videos (0.7%)
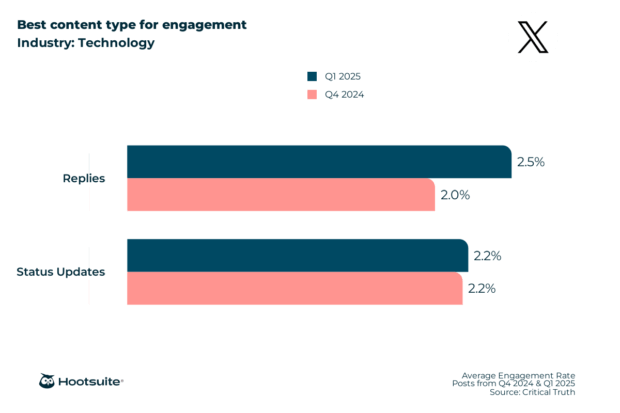
- X (Twitter) – Replies (2.5%)
Follower growth: Facebook 199.09%, TikTok 2.03%, Instagram 0.68%, LinkedIn 0.63%, X 0%.
Posting frequency & engagement: Facebook 25 posts/week for 1.67% engagement; Instagram 18 posts/week for 3.57%; LinkedIn 2 posts/week for 3.72%; X 19 posts/week for 2.59%; TikTok 3 posts/week for 0.74%.
Utilities & Energy
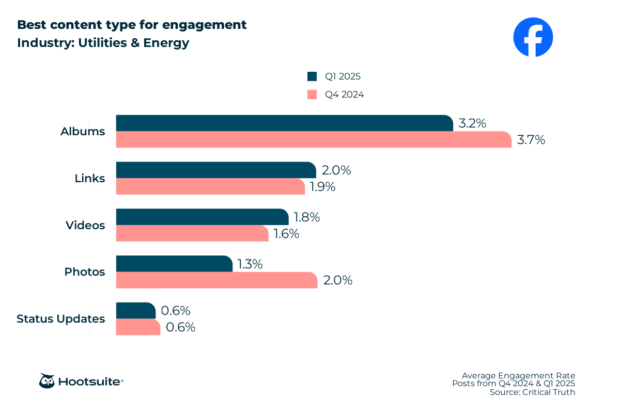
- Facebook – Albums (3.2%)
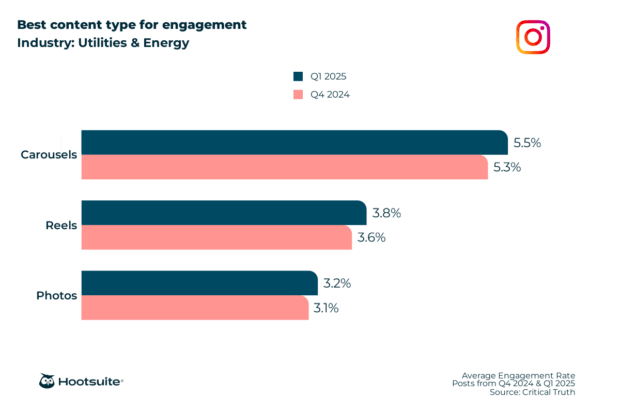
- Instagram – Carousels (5.5%)
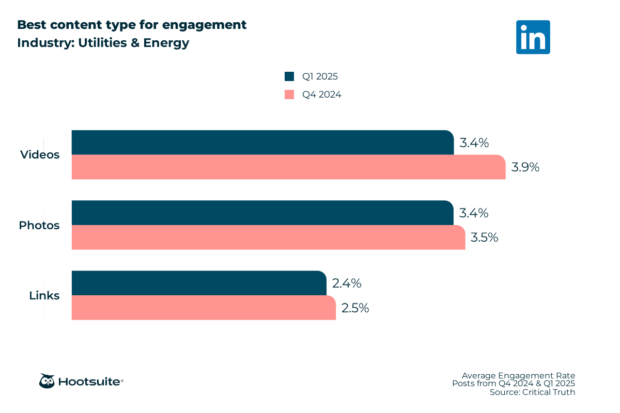
- LinkedIn – Videos & Photos (3.4%)
- TikTok – Videos (0.85%)
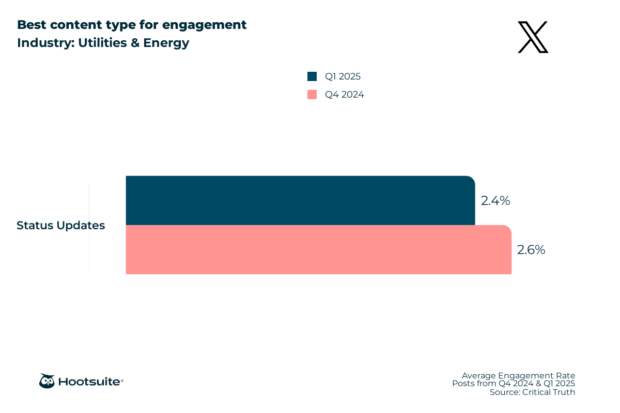
- X (Twitter) – Status Updates (2.4%)
Follower growth: LinkedIn 1.12%, Instagram 1.12%, Facebook 0.46%, TikTok 0.71%, X 0%.
Posting frequency & engagement: Facebook 4.8 posts/week for 2.24% engagement; Instagram 2 posts/week for 3.95%; LinkedIn 10 posts/week for 3.74%; X 10 posts/week for 2.60%; TikTok 5 posts/week for 0.85%.
Overall Insights
- Top platform for follower growth: TikTok (197.37% weekly).
- Highest engagement content types: Facebook Albums (2.9%), Instagram Carousels (4.2%), LinkedIn Videos (3.9%), TikTok Videos (1.5%), X Status Updates (1.8%).
- Industry‑specific average engagement rates generally fall between 2–4%; education peaks at 5.4% on Instagram, marketing agencies at 3.7% overall.
- Best posting frequency varies by platform: 2 posts/week often yields the highest engagement on Facebook, LinkedIn, and X, while Instagram may benefit from 20–30 posts/week.
Putting Benchmarks Into Practice
- Understand Your Position – Compare your metrics against the industry averages above to see where you excel or lag.
- Set Realistic Goals – Use the benchmark ranges to define attainable targets for reach, engagement, and follower growth.
- Learn from Leaders – Identify top performers in your sector, study their posting cadence and content mix, and adapt those insights.
- Test & Iterate – Benchmarks guide strategy, but ongoing experimentation will uncover the sweet spot for your unique audience.
Benchmarks are more than numbers; they’re a strategic compass that can accelerate growth, improve reporting credibility, and inform data‑driven decisions.
#1 Social Media Tool Grow your brand with the tool that helps you create, schedule, publish, engage, measure, and win—while staying compliant.
Book a Demo.