

Key Takeaways
- Engagement rate shows how many users actively interact with your content relative to reach, impressions, or follower count. It counts likes, comments, shares, saves, and other active actions—excluding passive views.
- The most common metric is Engagement Rate by Reach (ERR): total engagements ÷ reach × 100. Different formulas suit different goals—from organic posts to paid campaigns.
- Typical engagement rates fall between 1 % and 5 %. Benchmarks vary by platform and industry, so always compare against your specific context.
- Automated tools like Perch by Hootsuite remove manual calculations. They also provide industry benchmarks for quick comparison.
What Is Engagement Rate?
Engagement rate is a core social media metric that quantifies how actively your audience interacts with your content. It compares the total number of interactions—such as likes, comments, shares, saves, poll responses, messages, or link clicks—to a denominator that reflects audience size or content exposure.
Because each platform defines engagement slightly differently, it’s essential to understand the actions that feed into your chosen formula before you calculate.
Bonus! Use our free engagement rate calculator to determine your rate in four ways—post‑by‑post, campaign‑wide, or by time period—for any social network.
Why Engagement Rate Matters
- It tells you whether your content is resonating with viewers, as active interactions signal interest or usefulness.
- Higher rates help you earn better algorithmic placement, reaching new audiences.
- Engagement reflects trustworthiness and appeal, especially to first‑time profile visitors.
- For enterprise teams, it’s a clear way to demonstrate social ROI to leadership.
What Counts as Engagement on Each Platform?
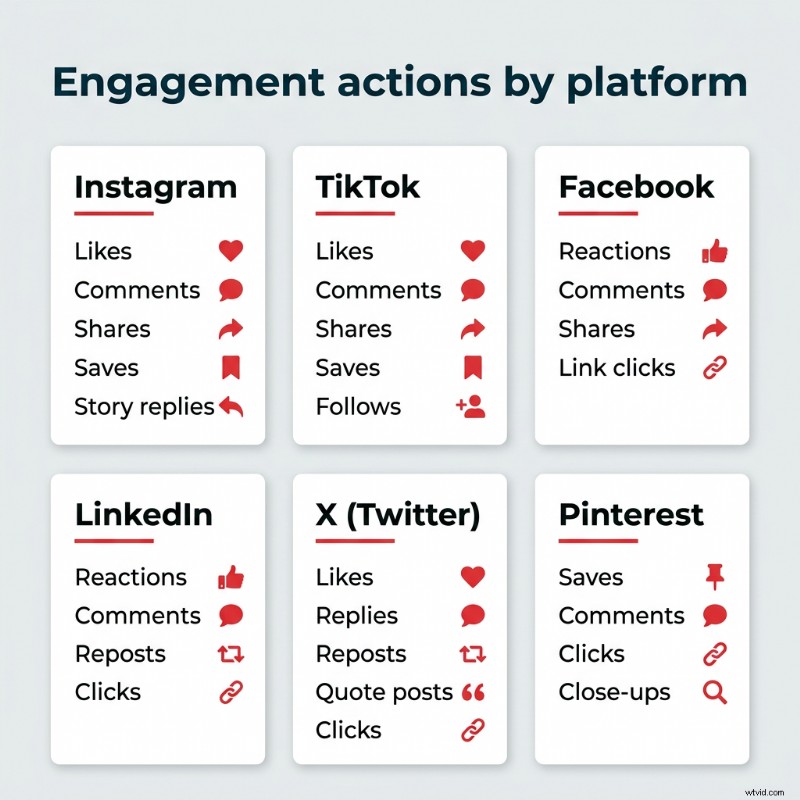
Engagement actions differ by channel. Here’s a quick reference:
- Instagram: likes, comments, shares, saves, Story replies
- TikTok: likes, comments, shares, saves, new follows
- Facebook: reactions, comments, shares, link/button clicks
- LinkedIn: reactions, comments, shares (reposts), clicks
- X (Twitter): likes, replies, retweets, quote posts, clicks
- Pinterest: repins, comments, clicks, close‑ups
Passive metrics such as impressions or views are not counted as engagement on their own. Verify each platform’s analytics to confirm which actions are included.
How to Calculate Engagement Rate for Free
Use our calculator or a platform‑agnostic tool like Perch by Hootsuite to compute:
- Overall account engagement rate
- Campaign‑specific rates
- Time‑period‑specific rates
Fill in the required fields—followers, posts, comments, shares, likes, saves, clicks, DMs—and let the tool handle the math. For more granular analysis, download our free spreadsheet calculator.
With Perch you also gain:
- Audience‑activity insights to schedule posts at optimal times
- Industry benchmark comparisons to gauge performance
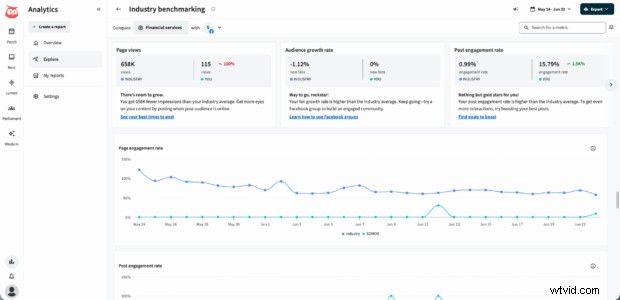
Perch automates engagement tracking across all your accounts in one intuitive dashboard.
Common Engagement Rate Formulas
Choose a formula that matches your measurement goal. Below are the six most widely used metrics:
- Engagement Rate by Reach (ERR) – Ideal for organic content. Formula: (Total engagements ÷ Reach) × 100.
- Engagement Rate by Post (ER‑post) – Best for comparing individual posts. Formula: (Total engagements ÷ Followers) × 100.
- Engagement Rate by Impressions (ER‑impressions) – Optimized for paid campaigns. Formula: (Total engagements ÷ Impressions) × 100.
- Daily Engagement Rate (Daily ER) – Long‑term account health. Formula: (Daily engagements ÷ Followers) × 100.
- Engagement Rate by Views (ER‑views) – Video‑centric. Formula: (Total engagements ÷ Video views) × 100.
- Cost Per Engagement (CPE) – Influencer or conversion focus. Formula: (Total spend ÷ Total engagements).
Choosing the Right Formula
Each denominator tells a different story:
| Formula | Best For | Denominator | Strength | Limitation |
|---|---|---|---|---|
| ERR | Organic posts | Reach | Captures actual viewers | Reach fluctuates |
| ER‑post | Post comparison | Followers | Stable baseline | Ignores viral reach |
| ER‑impressions | Paid ads | Impressions | Aligns with CPM | Lower rates; inconsistent |
| Daily ER | Long‑term analysis | Followers per day | Includes all content | Cannot distinguish single vs. multiple interactions |
| ER‑views | Video content | Video views | Relates engagement to view count | Repeat views lower rate |
| CPE | Influencer or conversion | Total spend | Shows cost efficiency | Requires consistent engagement definition |
For most teams, ERR is the default for organic content, while ER‑impressions is best for paid campaigns.
Automating Engagement Rate Calculation
Tools like Perch by Hootsuite collect engagement data across platforms and apply standard formulas automatically. This eliminates spreadsheets and provides:
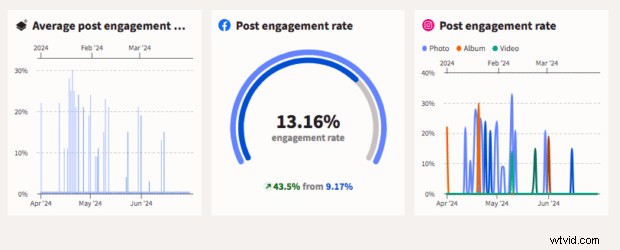
- High‑level dashboards that display average post engagement and content‑type breakdowns.
- Custom reports that show engagement trends, benchmark comparisons, and recommended posting times.
- Scheduled email reports in your preferred format.
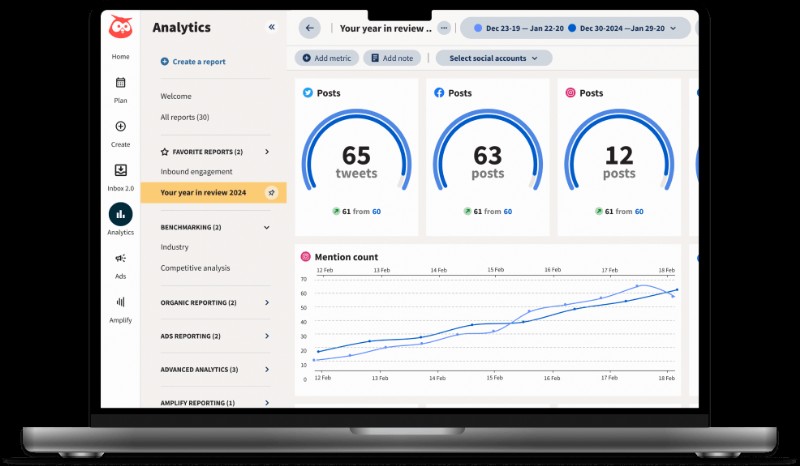
Example dashboard snapshot:
What Is a Good Engagement Rate? 2026 Benchmarks
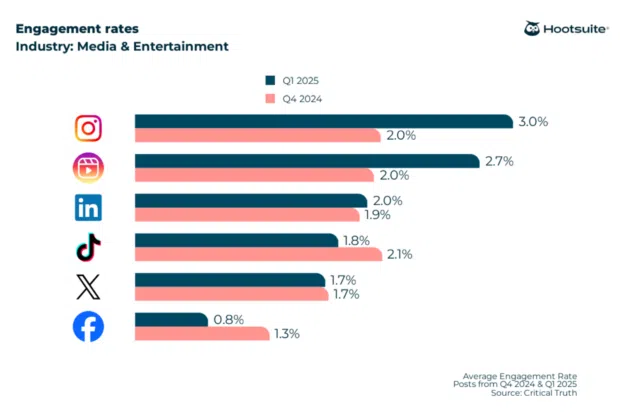
Benchmarks fluctuate by platform, industry, and follower size. In 2026, average rates are roughly:
- Instagram: 3 %
- Instagram Reels: 2.7 %
- LinkedIn: 2 %
- X (Twitter): 1.8 %
- TikTok: 1.5 %
- Facebook: 0.8 %
Industry‑specific tables (click to view full report from Hootsuite & Critical Truth) highlight variations. For example:
- Construction, Mining & Manufacturing: Instagram 4.4 %, LinkedIn 4.0 %
- Consumer Goods & Retail: LinkedIn 3.9 %, Instagram 3 %
- Dining, Hospitality & Tourism: LinkedIn 3.9 %, Instagram 3.1 %
- Finance: Instagram 3.8 %, LinkedIn 3.2 %
- Government: Instagram 3.5 %, LinkedIn 2.7 %
- Healthcare & Pharma: Instagram 3.7 %, LinkedIn 3.3 %
- Nonprofit: Instagram 4.4 %, Instagram Reels 4 %
How to Improve Your Engagement Rate
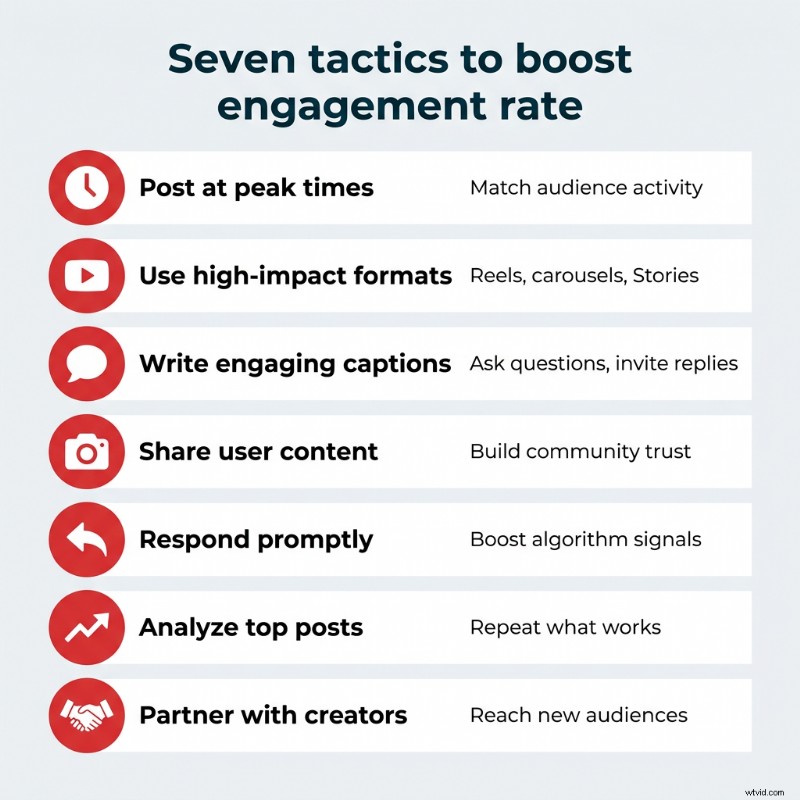
Incremental improvements across timing, format, and community engagement compound over time. Key tactics include:
- Post when your audience is most active. Analytics show 37 % of U.S. adults visit Facebook multiple times daily.
- Leverage high‑performing formats. Reels and TikToks drive ~44 % more interactions than images.
- Write conversation‑inviting captions. Pose questions or calls to action.
- Feature user‑generated content. Reshare customer photos, reviews, and mentions.
- Respond promptly to comments and DMs. Active engagement signals value to both audience and algorithm.
- Analyze top posts and replicate success. Reverse‑engineer winning content.
- Collaborate with the right creators. Partner with engaged advocates to reach new audiences.
Using Engagement Data in Your Strategy
- Fill your calendar with proven content. Use analytics to identify high‑impact formats per platform.
- Uncover audience sentiment. Comments, shares, and mentions provide free market intelligence.
- Report impact to leadership. Engagement rate offers a defensible metric for ROI.
- Detect early trend shifts. Sudden changes in rates can flag algorithm updates or audience shifts.
FAQ: Engagement Rate
What is engagement rate on social media and how is it calculated?
It measures audience interaction relative to reach, impressions, views, or follower count.
What is the formula for engagement rate?
Commonly: (Total engagements ÷ Reach) × 100. Swap reach for impressions, views, or followers as needed.
How do you calculate engagement rate in Excel?
Use = (Engagements / Reach) * 100. Example: =(A2/B2)*100.
What is a good engagement rate on social media?
Typically 1 %–5 %, but always benchmark against your platform and industry.
What counts as an engagement on social media?
Likes, comments, shares, saves, clicks, messages, and platform‑specific actions.
Should I calculate engagement rate by reach or by followers?
Use reach for organic content and follower count for post‑to‑post comparisons.
How do you improve engagement rate on social media?
Study successful formats, times, and topics; respond promptly; and refine strategy with data.
What are engagement rate benchmarks by platform?
See the table above—Instagram 3 %, Instagram Reels 2.7 %, LinkedIn 2 %, X 1.8 %, TikTok 1.5 %, Facebook 0.8 %.
Why does engagement rate matter more than follower count?
It reflects actual interaction and signals relevance to algorithms, driving organic reach.
Save time managing your social media marketing with Hootsuite. Use Perch to draft on‑brand captions, generate images and hashtags with AI, schedule and publish posts, measure results, and more—all from one platform.

By Christina Newberry

Christina has written on digital marketing since 2002 and has contributed to the Hootsuite blog since 2016.