
Webinars rank as the second most impactful video format in the 2025 State of Video Report. Measuring their success isn’t guesswork—it’s data-driven insight that tells you what’s working and where to refine your approach.
With a flood of possible metrics, it can be challenging to know which to prioritize. Below are the 13 most valuable metrics to track before, during, and after your live event. When you host webinars in Wistia, all of these are available in a single dashboard.
Pre‑Webinar Metrics
Success starts long before you hit "go live." Tracking registration and promotion data in the weeks leading up to the event gives you the real‑time insights you need to boost sign‑ups.
1. Number of Registrants
Seeing registrations climb is like watching your guest list fill for a party—exciting and encouraging. It’s the first tangible indicator of your promotional effectiveness. According to Wistia platform data, the average webinar pulls in 77 registrants.
Maintain momentum by promoting across multiple channels (five key spots are listed in the Wistia guide) and keep messaging alive up to the event day.
2. Registration Page Conversion Rate
Even if traffic is high, a low conversion rate signals that your registration page needs a refresh. Aim for a concise, compelling page that includes a clear description, host bios, and minimal form fields—ideally just first name, last name, and email.
3. Registration Rate by Channel
Identify which platforms deliver the most registrations. Wistia tracks impressions, registrations, and conversion rates per channel, with detailed referral insights and UTM data. Post‑webinar registration analytics now differentiate pre‑ and post‑event sign‑ups, and company logos help you spot key accounts.
Live Webinar Metrics
Numbers don’t pause when the session starts. Monitoring live engagement tells you how well you’re holding attention and can guide real‑time adjustments.
4. Focused Attendee Rate
Wistia measures how many attendees keep the webinar tab open and visible, offering heatmaps and watch‑time analytics to pinpoint attention dips.
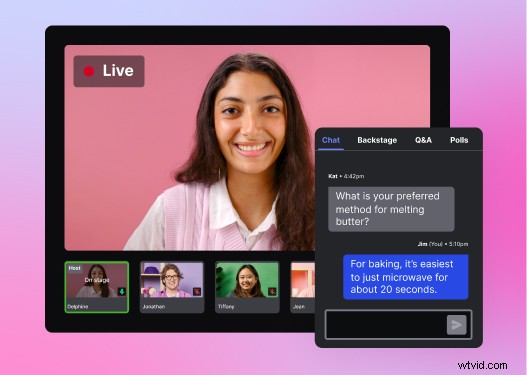
5. Chat Participation Rate
Active engagement is a stronger signal than passive attendance. A high chat rate indicates your content sparks conversation; if it’s low, invite questions or prompt discussion to re‑engage.
6. Attendee Drop‑off
Analyze when viewers leave and why. Frequent exits during Q&A may mean the session isn’t resonating—consider shortening answers or varying the format.
7. Audience Responses
Polls and quizzes gauge interest in real time. For instance, a poll asking “Would you like a demo?” can trigger a follow‑up for high‑intent leads. Wistia’s post‑event redirect URL can auto‑route attendees to a survey or additional content.
Post‑Webinar Metrics
After the curtain falls, evaluate whether the effort paid off. These key metrics help you measure ROI and refine future sessions.
8. Webinar Attendance Rate
Calculate the percentage of registrants who attended. Wistia automatically displays this figure. A 30–40% range is typical; compare against your own historical data to set realistic goals. Tracking monthly trends reveals which topics or frequencies drive higher attendance.
Wistia also shows replay performance alongside live analytics, enabling a holistic ROI assessment.
9. Lead Generation
Assess the volume and quality of leads—MQLs, SQLs, and closed‑won opportunities—generated during and after the webinar. Align topics with audience intent; for example, a demo‑focused webinar attracts prospects ready to test the product.
HubSpot workflows can now feed registrants directly into Wistia, automating reminders and insights.
10. Conversions
Track the actions attendees take that align with your objectives, such as ebook downloads, trial sign‑ups, or demo requests. Adjust calls to action, content pacing, or audience targeting if conversion rates lag expectations.
11. Brand Awareness
While intangible, brand lift can be gauged through social media metrics—new followers, post engagement, and sentiment. Incorporate a post‑webinar social push to amplify reach.
For deeper guidance, download our Webinar Guidebook and master the entire lifecycle.
On‑Demand Webinar Metrics
Turning live sessions into evergreen on‑demand content extends reach and drives long‑term leads. Current data shows 40% of total webinar views come from replays, and 65% of marketers host replays on dedicated landing pages.
Repurposing is a powerful strategy: 90% of marketers transform recordings into blog posts, social clips, or email campaigns. The Video Repurposing Cookbook offers practical tactics.
Store all recordings in a Wistia Channel, which now supports live, upcoming, and on‑demand webinars in a single hub for easier discovery.
12. Form Submissions
Gate your on‑demand recording with a lead capture form to log names and emails. This allows you to track viewership and identify high‑intent prospects—such as those who watch at least 50% of the video.
13. On‑Demand Audience Engagement
- Play Rate: % of visitors who start the video.
- CTA Conversion Rate: % of viewers who act on the call to action.
- Chapter Views: Individual segment performance.
Boost play rate with compelling thumbnails and titles; move CTAs to the beginning for longer videos and to the end for shorter ones; trim or reposition low‑view chapters.
Turn Analytics into Actionable Insights
Consistently tracking these KPIs throughout the webinar journey empowers you to refine strategy, improve content, and boost ROI—all within Wistia’s unified analytics platform.